Solutions
Practice Set 11.1
Question 1.1. The following table shows the number of saplings planted by 30 students. Fill in the boxes and find the average number of saplings planted by each student.
| No. of saplings (Scores) xi | No. of students (frequency) fi | fi × xi |
| 1 | 4 | 4 |
| 2 | 6 | [?] |
| 3 | 12 | [?] |
| 4 | 8 | [?] |
| N = [?] | Σ fixi = [?] |
Mean (\(\bar{x}\)) = \(\frac{[?]}{N}\) =\(\frac{[?]}{[?]}\)= [?]
∴ The average number of trees planted [?]
| No. of saplings (Scores) xi | No. of students (frequency) fi | fi × xi |
| 1 | 4 | 4 |
| 2 | 6 | [12] |
| 3 | 12 | [36] |
| 4 | 8 | [32] |
| N = [30] | Σ fixi = [84] |
Mean (\(\bar{x}\)) = \(\frac{∑f_ix_i}{N}\) = \(\frac{84}{30}\) = [2.8]
∴ The average number of trees planted [2.8]
Question 1.2. The following table shows the electricity (in units) used by 25 families of Eklara village in a month of May. Complete the table and answer the following questions.
| Electricity used (Units) xi | No. of families (frequency) fi | fi × xi |
| 30 | 7 | …… |
| 45 | 2 | …… |
| 60 | 8 | …… |
| 75 | 5 | …… |
| 90 | 3 | …… |
| N = ….. | Σ fixi = … |
(1) How many families use 45 units electricity ?
(2) State the score, the frequency of which is 5.
(3) Find N, and Σ fixi
(4) Find the mean of electricity used by each family in the month of May.
| Electricity used (Units) xi | No. of families (frequency) fi | fi × xi |
| 30 | 7 | 210 |
| 45 | 2 | 90 |
| 60 | 8 | 480 |
| 75 | 5 | 375 |
| 90 | 3 | 270 |
| N = 25 | Σ fixi = 1425 |
(1) 2 families
(2) The score is 75
(3) N = 25; Σ fixi = 1425
(4) Mean (\(\bar{x}\)) = \(\frac{∑f_ix_i}{N}\) = \(\frac{1425}{25}\) = 57
The mean of electricity used by each family is 57 units.
Question 1.3. The number of members in the 40 families in Bhilar are as follows: 1, 6, 5, 4, 3, 2, 7, 2, 3, 4, 5, 6, 4, 6, 2, 3, 2, 1, 4, 5, 6, 7, 3, 4, 5, 2, 4, 3, 2, 3, 5, 5, 4, 6, 2, 3, 5, 6, 4, 2. Prepare a frequency table and find the mean of members of 40 families.
| Number of members xi | Tally marks | Number of families fi | fi × xi |
| 1 | || | 2 | 2 |
| 2 | |||| ||| | 8 | 16 |
| 3 | |||| || | 7 | 21 |
| 4 | |||| ||| | 8 | 32 |
| 5 | |||| || | 7 | 35 |
| 6 | |||| | | 6 | 36 |
| 8 | 2 | 14 | |
| N = 40 | Σ fixi = 156 |
Mean (\(\bar{x}\)) = \(\frac{∑f_ix_i}{N}\) = \(\frac{156}{40}\) = 3.9
Answer is : The mean of members of families = 3.9
Question 1.4. The number of Science and Mathematics projects submitted by Model high school, Nandpur in last 20 years at the state level science exhibition is : 2, 3, 4, 1, 2, 3, 1, 5, 4, 2, 3, 1, 3, 5, 4, 3, 2, 2, 3, 2. Prepare a frequency table and find the mean of the data.
| Number of projects xi | Tally Marks | Number of years fi | fi × xi |
| 1 | ||| | 3 | 3 |
| 2 | |||| | | 6 | 12 |
| 3 | |||| | | 6 | 18 |
| 4 | ||| | 3 | 12 |
| 5 | || | 2 | 10 |
| N = 20 | Σ fixi = 55 |
Mean (\(\bar{x}\)) = \(\frac{∑f_ix_i}{N}\) = \(\frac{55}{20}\) = 2.75
Answer is : Mean of the data = 2.75
Practice Set 11.2
Question 2.1. Observe the following graph and answer the questions.
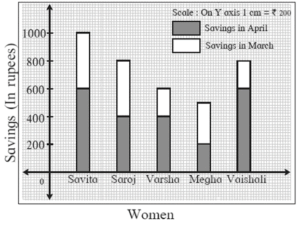
(1) State the type of the graph.
(2) How much is the savings of Vaishali in the month of April?
(3) How much is the total of savings of Saroj in the months March and April?
(4) How much more is the total savings of Savita than the total savings of Megha?
(5) Whose savings in the month of April is the least?
(1) The given graph is a subdivided bar graph.
(2) The savings of Vaishali in the month of April is ₹ 600.
(3) The total of savings of Saroj in the months of March and April is ₹ 800.
(4) The total savings by Savita is ₹ 1000 and that by Megha is ₹ 500. ₹ (1000-500) = ₹ 500.
The total savings by Savita is ₹ 500 more than that of Megha.
(5) The savings of Megha is the least in the month of April.
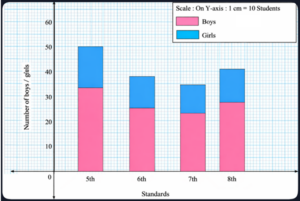
Question 2.2. The number of boys and girls, in std 5 to std 8 in a Z.P. school is given in the table. Draw a subdivided bar graph to show the data.
(Scale : On Y axis, 1cm= 10 students)
| Standard | 5th | 6th | 7th | 8th |
| Boys | 34 | 26 | 21 | 25 |
| Girls | 17 | 14 | 14 | 20 |
| Standard | 5th | 6th | 7th | 8th |
| Boys | 34 | 26 | 21 | 25 |
| Girls | 17 | 14 | 14 | 20 |
| Total | 51 | 40 | 35 | 45 |
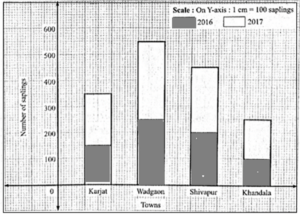
Question 2.3. In the following table number of trees planted in the year 2016 and 2017 in four towns is given. Show the data with the help of subdivided bar graph.
| Town →
year↓ |
Karjat | Wadgoan | Shivapur | Khandala |
| 2016 | 150 | 250 | 200 | 100 |
| 2017 | 200 | 300 | 250 | 150 |
| Town →
year↓ |
Karjat | Wadgoan | Shivapur | Khandala |
| 2016 | 150 | 250 | 200 | 100 |
| 2017 | 200 | 300 | 250 | 150 |
| Total | 350 | 550 | 450 | 250 |
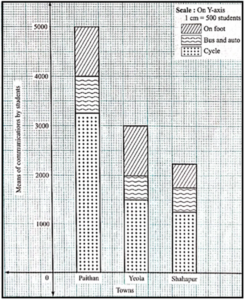
Question 2.4. In the following table, data of the transport means used by students in 8th standard for commutation between home and school is given. Draw a subdivided bar diagram to show the data. (Scale : On Y axis : 1 cm = 500 students)
| Town →
Mean of commutation ↓ |
Paithan | Yeola | Shahapur |
| cycle | 3250 | 1500 | 1250 |
| Bus and Auto | 750 | 500 | 500 |
| On foot | 1000 | 1000 | 500 |
| Town →
Mean of commutation ↓ |
Paithan | Yeola | Shahapur |
| cycle | 3250 | 1500 | 1250 |
| Bus and Auto | 750 | 500 | 500 |
| On foot | 1000 | 1000 | 500 |
| Total | 5000 | 3000 | 2250 |
Practice Set 11.3
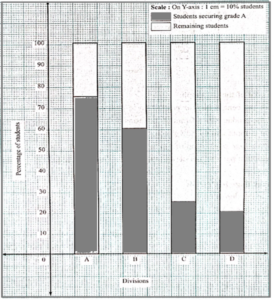
Question 3.1. Show the following information by a percentage bar graph.
| Division of standard 8 | A | B | C | D |
| Number of students securing grade A | 45 | 33 | 10 | 15 |
| Total number of students | 60 | 55 | 40 | 75 |
| Division of standard 8 | A | B | C | D |
| Number of students securing grade A | 45 | 33 | 10 | 15 |
| Total number of students | 60 | 55 | 40 | 75 |
| Percentage of students securing grade A | \(\frac{45}{60}\) x 100 = 75 | \(\frac{33}{55}\) x 100 = 60 | \(\frac{10}{400}\) x 100 = 25 | \(\frac{15}{75}\) x 100 = 20 |
| Percentage of the remaining students | 100 – 75 = 25 | 100 – 60 = 40 | 100 – 25 = 75 | 100 – 20 = 80 |
Question 3.2. Observe the following graph and answer the questions
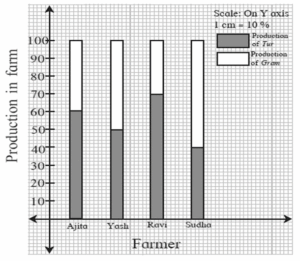
(1) State the type of the bar graph.
(2) How much percent is the Tur production to total production in Ajita’s farm ?
(3) Compare the production of Gram in the farms of Yash and Ravi and state whose percentage of production is more and by how much ?
(4) Whose percentage production of Tur is the least?
(5) State production percentages of Tur and gram in Sudha’s farm.
(1) It is a percentage bar graph.
(2) The Tur production is 60 %.
(3) Gram production : Yash's farm : 50%; Ravi's farm : 30%. Gram production in Yash's farm is more by 20% [50 - 20].
(4) The percentage production of Tur is least in Sudha's farm.
(5) The percentage production of Tur in Sudha's farm : 40% and the percentage production of gram : 60%.
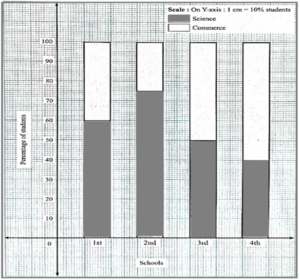
Question 3.3. The following data is collected in a survey of some students of 10th standard from some schools. Draw the percentage bar graph of the data.
| School | 1st | 2nd | 3rd | 4th |
| Inclination towards science stream | 90 | 60 | 25 | 16 |
| Inclination towards commerce stream | 60 | 20 | 25 | 24 |
| School | 1st | 2nd | 3rd | 4th |
| Inclination towards science stream | 90 | 60 | 25 | 16 |
| Inclination towards commerce stream | 60 | 20 | 25 | 24 |
| Total | 150 | 80 | 50 | 40 |
| Percent inclination towards science stream | \(\frac{90}{150}\) x 100 = 60 | \(\frac{60}{80}\) x 100 = 75 | \(\frac{25}{50}\) x 100 = 50 | \(\frac{16}{40}\) x 100 = 40 |
| Percent inclination towards commerce stream | 100 – 60 = 40 | 100 – 75 = 25 | 100 – 50 = 50 | 100 – 40 = 60 |