Notes
|
Topics to be learn :
|
Statistics is defined as a distinct branch of knowledge dedicated to collecting information regarding a specific problem or situation, analyzing that information, and drawing conclusions after thorough interpretation.
Recall :
Average : For a simple set of numbers, you find the average by adding all the scores together and then dividing that sum by the total number of scores.
- Formula: Average = \(\frac{\text{Sum of all scores}}{\text{Total no of scores}}\)
For example, if someone reads 60, 50, 54, 46, and 50 pages over five days, the average is found by adding these five numbers and dividing by five.
Average = \(\frac{60+50+54+46+50}{5}\) = \(\frac{260}{5}\) = 52 pages reads per day
The average is also known as ‘Arithmetic mean’ or ‘Mean’.
Arithmetic Mean :
The "average" of a set of numerical data is formally referred to in statistical language as the arithmetic mean or simply the mean. It represents the central value of a dataset.
∴ Mean = \(\frac{\text{Sum of all scores}}{\text{Total no of scores}}\)
If the scores are more, adding them will take a lot of time. This is simplified by making a frequency distribution table.
Steps to Calculate Mean via Frequency Table :
- Tabulation: Write the scores (xi) in the first column, typically in ascending order.
- Tallying: Use tally marks in the second column to count the occurrences of each score.
- Frequency (fi): Count the tally marks and record the frequency of each score. The sum of all frequencies is denoted as N.
- Product (fixi): Multiply each score by its frequency and record the result in the final column.
- Summation (∑): Calculate the sum of all products in the last column. The symbol ∑ (sigma) is used to indicate "sum."
- Final Calculation: Use the formula: Mean (\(\bar{x}\)) = \(\frac{∑f_ix_i}{N}\)
Example :
Q.1. The marks obtained by 37 students of std 8 in a test of 10 marks are given below. Find the mean of the data.
2, 4, 4, 8, 6, 7, 3, 8, 9, 10, 10, 8, 9, 7, 6, 5, 4, 6, 7, 8, 4, 8, 9, 7, 6, 5, 10, 9, 7, 9, 10, 9, 6, 9, 9, 4, 7.
Solution :
If we go on adding the scores one after the other, it will take lot of time. So let us use the frequency distribution table method to classifying them.
| Marks, xi Scores | Tally Marks | No. of students frequency fi | fi × xi |
| 2 | | | 1 | 1 × 2 = 2 |
| 3 | | | 1 | 1 × 3 = 3 |
| 4 | ||||| | 5 | 5 × 4 = 20 |
| 5 | || | 2 | 2 × 5 = 10 |
| 6 | ||||| | 5 | 5 × 6 = 30 |
| 7 | ||||| | | 6 | 6 × 7 = 42 |
| 8 | ||||| | 5 | 5 × 8 = 40 |
| 9 | ||||| ||| | 8 | 8 × 9 = 72 |
| 10 | |||| | 4 | 4 × 10 = 40 |
| N = 37 | Σ fixi = 259 |
Mean (\(\bar{x}\)) = \(\frac{∑f_ix_i}{N}\) =\(\frac{259}{37}\) = 7
Subdivided Bar Graph/Diagram :
As in a joint bar graph, we can compare the information in a data by a subdivided bar diagram also.
- In subdivided bar diagram, each bar represents a total value.
- The bar is divided into parts to show actual values of each component.
- The length of the bar varies depending on the total.
- Used when you want to compare both totals and parts.
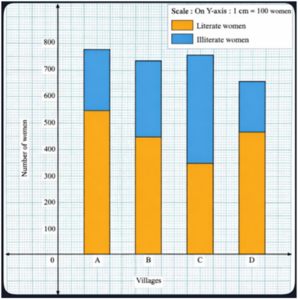
Example : Q.1. The numbers of literate and illiterate women living in four villages are given below. Show the information by a subdivided bar graph. (Scale : On Y-axis, 1 cm = 100 women)
| Village | A | B | C | D |
| Literate women | 540 | 440 | 340 | 460 |
| Illiterate women | 230 | 290 | 410 | 190 |
| Total | 770 | 730 | 750 | 650 |
Solution :
Steps for drawing a subdivided graph :
(1) Prepare a table of the given data, (If the table is not given.)
(2) Draw the X-axis and Y-axis on a graph paper.
(3) Write the names of the villages on X-axis, keeping equal distances between two consecutive bars.
(4) Show the number of women on Y-axis with a proper scale.
(5) Show the total number of women in a village by a single bar.
(6) Show the number of literate women by a part of the bar by some mark. (Say, orange in colour)
(7) The remaining part of the bar will represent the number of illiterate women. Show this part by
another mark. (Say, blue in colour)
(8) Similarly, draw the subdivided bars for the other villages. Observe the graph drawn for the given data.
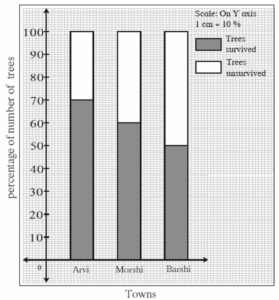
Percentage Bar Graph/Diagram :
A subdivided bar graph which is drawn by converting the data into percentage is called a percentage bar graph.
- This graph is created by converting the data into percentages. Instead of using raw numbers, it shows the relative proportion of each part out of 100.
- All bars in the graph are of a uniform height of 100 units, as they represent 100% of the data for each category.
- Useful when raw numbers are not sufficient to compare success or trends across different groups.
Example :
In the town Arvi, 42 trees out of 60 trees planted are survived and in the town Morshi 45 trees out of 75 are survived. In the town Barshi 45 trees out of 90 are survived.
To know in which town the plantation is more successful, only numbers of trees
planted are not sufficient. For that we have to find percentage of survived plants.
First of all we prepare a table as follows.
| Town | Arvi | Morshi | Barshi |
| Total number of trees | 60 | 75 | 90 |
| Trees survived | 42 | 45 | 45 |
| Percentage of survived trees | \(\frac{42}{60}\) × 100 = 70 | \(\frac{45}{75}\) ×100 = 60 | \(\frac{45}{90}\) × 100 = 50 |
From these percentages notice that the percentage of survival of trees in Arvi is more. It means the percentages give somewhat different information.