
Solutions- Practice Set and Problem Sets
Practice set 7.1
Question 1.1. The following table shows the number of Buses and Trucks in nearest lakh units. Draw percentage bar-diagram. (Approximate the percentages to the nearest integer)
| Year | No. of Trucks | No. of Buses |
| 2005-2006 | 47 | 9 |
| 2007-2008 | 56 | 13 |
| 2008-2009 | 60 | 16 |
| 2009-2010 | 63 | 18 |
We need a Percentage Bar Diagram. That means for each year, we calculate what percent is Trucks and what percent is Buses out of the total.
Step 1: Find totals
- 2005–06 → 47 + 9 = 56
- 2007–08 → 56 + 13 = 69
- 2008–09 → 60 + 16 = 76
- 2009–10 → 63 + 18 = 81
Step 2: Find percentages (approx. nearest integer)
2005–06:
- Trucks = (47 ÷ 56) × 100 ≈ 84%
- Buses = (9 ÷ 56) × 100 ≈ 16%
2007–08:
- Trucks = (56 ÷ 69) × 100 ≈ 81%
- Buses = (13 ÷ 69) × 100 ≈ 19%
2008–09:
- Trucks = (60 ÷ 76) × 100 ≈ 79%
- Buses = (16 ÷ 76) × 100 ≈ 21%
2009–10:
- Trucks = (63 ÷ 81) × 100 ≈ 78%
- Buses = (18 ÷ 81) × 100 ≈ 22%
Step 3: Table for percentage bar diagram
| Year | Trucks (%) | Buses (%) |
| 2005–06 | 84% | 16% |
| 2007–08 | 81% | 19% |
| 2008–09 | 79% | 21% |
| 2009–10 | 78% | 22% |
The percentage bar graph of the data is given below :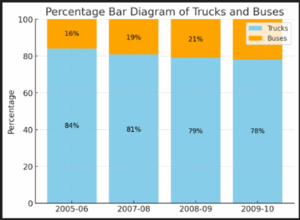
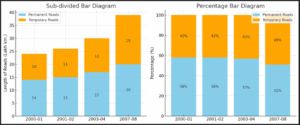
Question 1.2. In the table given below, the information is given about roads. Using this draw sub-divided and percentage bardiagram (Approximate the percentages to the nearest integer)
| Year | Permanent Roads (Lakh km.) |
Temporary Roads (Lakh km.) |
| 2000-2001 | 14 | 10 |
| 2001-2002 | 15 | 11 |
| 2003-2004 | 17 | 13 |
| 2007-2008 | 20 | 19 |
We need to draw two diagrams:
- Sub-divided Bar Diagram (actual values)
- Percentage Bar Diagram (converted to %).
Step 1: Total values
| Year | Permanent Roads | Temporary Roads | Total |
| 2000–01 | 14 | 10 | 24 |
| 2001–02 | 15 | 11 | 26 |
| 2003–04 | 17 | 13 | 30 |
| 2007–08 | 20 | 19 | 39 |
Step 2: Percentage calculation
| Year | Permanent (%) | Temporary (%) |
| 2000–01 | (14/24) × 100 ≈ 58% | (10/24) × 100 ≈ 42% |
| 2001–02 | (15/26) × 100 ≈ 58% | (11/26) × 100 ≈ 42% |
| 2003–04 | (17/30) × 100 ≈ 57% | (13/30) × 100 ≈ 43% |
| 2007–08 | (20/39) × 100 ≈ 51% | (19/39) × 100 ≈ 49% |
Step 3 : Sub-divided and percentage bar diagram :
Practice set 7.2
Question 2.1. Classify following information as primary or secondary data.
(i) Information of attendance of every student collected by visiting every class in a school.
Primary data
(ii) The information of heights of students was gathered from school records and sent to the head office, as it was to be sent urgently.
Secondary data
(iii) In the village Nandpur, the information collected from every house regarding students not attending school.
Primary data
(iv) For science project, information of trees gathered by visiting a forest.,
Primary data
Practice set 7.3
Question 3.1. For class interval 20-25 write the lower class limit and the upper class limit.
For class interval 20-25.
The lower class limit is 20 and the upper class limit is 25.
Question 3.2. Find the class-mark of the class 35-40.
Class mark = \(\frac{\text{Lower class limit + Upper class limit}}{2}\) = \(\frac{35+40}{2}\) = 37.5
The class mark for the class 35-40 is 37.5.
Question 3.3. If class mark is 10 and class width is 6 then find the class.
Let the lower class limit and the upper class limit of the required class be x and y respectively.
Class mark = \(\frac{\text{Lower class limit + Upper class limit}}{2}\) = \(\frac{x+y}{2}\)
∴ 10 = \(\frac{x+y}{2}\)
∴ x + y = 20 i.e. y + x = 20 ….(i)
Class width = the upper class limit - the lower class limit
∴ 6 = y - x ∴ y - x = 6 ….(ii)
Adding (i) and (ii), 2y = 26
∴ y = 26/2 = 13 ….(iii)
x + y = 20
∴ x + 13 = 20 ... [From (iii)]
∴ x = 20 – 13 = 7
The required class is 7-13.
Question 3.4. Complete the following table.
| Classes (age) | Tally marks | Frequency (No. of students) |
| 12-13 | llll | [ ] |
| 13-14 | llll llll llll | [ ] |
| 14-15 | [ ] | |
| 15-16 | llll | [ ] |
| N= ∑f = 35 |
| Classes (age) | Frequency (No. of students) |
| 12-13 | 5 |
| 13-14 | 14 |
| 14-15 | …… |
| 15-16 | 4 |
| N= ∑f = 35 |
Let the frequency of class 14-15 be x.
5 + 14 + x + 4=35 ∴ 23 + x = 35
∴ x = 35 – 23 = 12
The frequency of class 14 - 15 is 12.
The completed table is given below :
| Classes (age) | Tally marks | Frequency (No. of students) |
| 12-13 | llll | [ 5 ] |
| 13-14 | llll llll llll | [ 14 ] |
| 14-15 | llll llll ll | [ 12 ] |
| 15-16 | llll | [ 4 ] |
| N= ∑f = 35 |
Question 3.5. In a ‘tree plantation’ project of a certain school there are 45 students of 'Harit Sena.' The record of trees planted by each student is given below :
3, 5, 7, 6, 4, 3, 5, 4, 3, 5, 4, 7, 5 , 3, 6, 6, 5, 3, 4, 5, 7, 3, 5, 6, 4, 4, 3, 5, 6, 6, 4, 3, 5, 7, 3, 4, 5, 7, 6, 4, 3, 5, 4, 4, 7.
Prepare a frequency distribution table of the data.
Step 1: Find the distinct values
- Trees planted can be 3, 4, 5, 6, 7.
Step 2: Count frequencies
- 3 trees → count = 10
- 4 trees → count = 11
- 5 trees → count = 11
- 6 trees → count = 7
- 7 trees → count = 6
Total = 10 + 11 + 11 + 7 + 6 = 45
Frequency distribution table :
| Class (Number of saplings) |
Tally marks | Frequency |
| 3 | llll llll | 10 |
| 4 | llll llll l | 11 |
| 5 | llll llll l | 11 |
| 6 | llll ll | 7 |
| 7 | llll l | 6 |
| N = Σf = 45 |
Question 3.6. The value of π upto 50 decimal places is given below :
3.14159265358979323846264338327950288419716939937510
From this information prepare an ungrouped frequency distribution table of digits appearing after the decimal point.
| Digits | Tally marks | Frequency (f) |
| 0 | ll | 2 |
| 1 | llll | 5 |
| 2 | llll | 5 |
| 3 | llll lll | 8 |
| 4 | llll | 4 |
| 5 | llll | 5 |
| 6 | llll | 4 |
| 7 | llll | 4 |
| 8 | llll | 5 |
| 9 | llll lll | 8 |
| N = Σf = 50 |
Question 3.7. In the tables given below, class-mark and frequencies is given. Construct the frequency tables taking inclusive and exclusive classes.
(i)
| Class width | Frequency |
| 5 | 3 |
| 15 | 9 |
| 25 | 15 |
| 35 | 13 |
Let the lower class limit and the upper class limit of the class mark 5 be x1 and x2 respectively.
Then 5 = (x1 + x2)/2
∴ x1 + x2 = 10 ….(i)
Class width = 35 - 25 = 25 - 15 = 15 - 5 = 10
∴ the difference between the upper class limit and lower class limit = 10
i.e. x2 - x1 = 10 ….(ii)
From (i) and (ii),
x1 = 0 and x2 = 10
∴ the first class is 0-10.
Similarly the other classes can be found.
Exclusive classes :
| Class | Class mark | Frequency |
| 0-10 | 5 | 3 |
| 10-20 | 15 | 9 |
| 20-30 | 25 | 15 |
| 30-40 | 35 | 13 |
Inclusive classes :
| Class | Class mark | Frequency |
| 0.5-9.5 | 5 | 3 |
| 10.5-19.5 | 15 | 9 |
| 20.5-29.5 | 25 | 15 |
| 30.5-39.5 | 35 | 13 |
For inclusive classes : Subtract 0.5 from the upper class limit and add 0.5 to the lower class limit.]
(ii)
| Class width | Frequency |
| 22 | 6 |
| 24 | 7 |
| 26 | 13 |
| 28 | 4 |
Let the lower class limit and the upper class limit of the class mark 22 be x1 and x2 respectively.
Then 22 = (x1 + x2)/2
∴ x1 + x2 = 44 ….(i)
Class width = 24 - 22 = 26 - 24 = 28 - 26 = 2
∴ the difference between the upper class limit and lower class limit = 2
i.e. x2 - x1 = 2 ….(ii)
From (i) and (ii),
x1 = 21 and x2 = 23
∴ the first class is 21-23.
Similarly the other classes can be found.
Exclusive classes :
| Class | Class mark | Frequency |
| 21-23 | 22 | 6 |
| 23-25 | 24 | 7 |
| 25-27 | 26 | 13 |
| 27-29 | 28 | 4 |
Inclusive classes :
| Class | Class mark | Frequency |
| 21.5 - 22.5 | 22 | 6 |
| 23.5 - 24.5 | 24 | 7 |
| 25.5-26.5 | 26 | 13 |
| 27.5-28.5 | 28 | 4 |
Question 3.8. In a school, 46 students of 9th standard, were told to measure the lengths of the pencils in their compass-boxes in centimeters. The data collected was as follows.
16, 15, 7, 4.5, 8.5, 5.5, 5, 6.5, 6, 10, 12, 13, 4.5, 4.9, 16, 11, 9.2, 7.3, 11.4, 12.7, 13.9, 16, 5.5, 9.9, 8.4, 11.4, 13.1, 15, 4.8, 10, 7.5, 8.5, 6.5, 7.2, 4.5, 5.7, 16, 5.7, 6.9, 8.9, 9.2, 10.2, 12.3, 13.7, 14.5, 10
By taking inclusive classes 0-5, 5-10, 10-15.... prepare a grouped frequency distribution table.
| Class | Tally marks | Frequency |
| 0- 5 | llll | 5 |
| 5-10 | llll llll llll llll | 20 |
| 10-15 | llll llll llll | 15 |
| 15-20 | llll l | 6 |
| N = Σf = 46 |
Question 3.9. In a village, the milk was collected from 50 milkmen at a collection center in litres as given below :
27, 75, 5, 99, 70, 12, 15, 20, 30, 35, 45, 80, 77, 90, 92, 72, 4, 33, 22, 15, 20, 28, 29, 14, 16, 20, 72, 81, 85, 10, 16, 9, 25, 23, 26, 46, 55, 56, 66, 67, 51, 57, 44, 43, 6, 65, 42, 36, 7, 35.
By taking suitable classes, prepare grouped frequency distribution table.
We take the classes 0-10, 10-20, ... , 90-100.
| Class | Tally marks | Frequency |
| 0-10 | llll | 5 |
| 10-20 | llll ll | 7 |
| 20-30 | llll llll | 10 |
| 30-40 | llll | 5 |
| 40-50 | llll | 5 |
| 50-60 | llll | 4 |
| 60-70 | lll | 3 |
| 70-80 | llll | 5 |
| 80-90 | lll | 3 |
| 90-100 | lll | 3 |
| N = Σf = 50 |
Question 3.10. 38 people donated to an organisation working for differently abled persons. The amount in rupees were as follows :
101, 500, 401, 201, 301, 160, 210, 125, 175, 190, 450, 151, 101, 351, 251, 451, 151, 260, 360, 410, 150, 125, 161, 195, 351, 170, 225, 260, 290, 310, 360, 425, 420, 100, 105, 170, 250, 100.
(i) By taking classes 100-149, 150-199, 200-249... prepare grouped frequency distribution table.
(ii) From the table, find the number of people who donated rupees 350 or more.
Frequency distribution table :
| Class | Tally Marks | Frequency |
| 100-149 | llll ll | 7 |
| 150-199 | llll llll | 10 |
| 200-249 | lll | 3 |
| 250-299 | llll | 5 |
| 300-349 | ll | 2 |
| 350-399 | llll | 4 |
| 400-449 | llll | 4 |
| 450-499 | ll | 2 |
| 500-549 | l | 1 |
| N = Σf = 38 |
(ii) The number of persons donating ₹ 350 or more is 4 + 4 + 2 + 1 = 11.
Practice set 7.4
Question 4.1. Complete the following cumulative freuqency table :
| Class (Height in cm) | Frequency (No. of students) | Less than type frequency |
| 150-153 | 05 | 05 |
| 153-156 | 07 | 05 + [ ] = [ ] |
| 156-159 | 15 | [ ] + 15 = [ ] |
| 159-162 | 10 | [ ] + [ ] = 37 |
| 162-165 | 05 | 37 + 5 = 42 |
| 165-168 | 03 | [ ] + [ ] = 45 |
| Total N = 45 |
| Class (Height in cm) | Frequency (No. of students) | Less than type frequency |
| 150-153 | 05 | 05 |
| 153-156 | 07 | 05 + [ 7 ] = [ 12 ] |
| 156-159 | 15 | [ 12 ] + 15 = [ 27 ] |
| 159-162 | 10 | [ 27 ] + [ 10 ] = 37 |
| 162-165 | 05 | 37 + 5 = 42 |
| 165-168 | 03 | [ 42 ] + [ 3 ] = 45 |
| Total N = 45 |
Question 4.2. Complete the following Cumulative Frequency Table :
| Class
(Monthly income in Rs.) |
Frequency
(No. of individuals) |
More than or equal to
type cumulative frequency |
| 1000-5000 | 45 | |
| 5000-10000 | 19 | .. |
| 10000-15000 | 16 | |
| 15000-20000 | 02 | ......... |
| 20000-25000 | 05 | ........ |
| Total N=87 |
| Class
(Monthly income in Rs.) |
Frequency
(No. of individuals) |
More than or equal to
type cumulative frequency |
| 1000-5000 | 45 | 87 |
| 5000-10000 | 19 | 87 - 45 = 42 |
| 10000-15000 | 16 | 42 - 19 = 23 |
| 15000-20000 | 02 | 23 - 16 = 7 |
| 20000-25000 | 05 | 7 – 2 = 5 |
| Total N = 87 |
Question 4.3. The data is given for 62 students in a certain class regarding their mathematics marks out of 100. Take the classes 0-10, 10-20.. and prepare frequency distribution table and cumulative frequency table more than or equal to type.
55, 60, 81, 90, 45, 65, 45, 52, 30, 85, 20, 10, 75, 95, 09, 20, 25, 39, 45, 50, 78, 70, 46, 64, 42, 58, 31, 82, 27, 11, 78, 97, 07, 22, 27, 36, 35, 40, 75, 80, 47, 69, 48, 59, 32, 83, 23, 17, 77, 45, 05, 23, 37, 38, 35, 25, 46, 57, 68, 45, 47, 49.
From the prepared table, answer the following questions :
(i) How many students obtained marks 40 or above 40 ?
(ii) How many students obtained marks 90 or above 90 ?
(iii) How many students obtained marks 60 or above 60 ?
(iv) What is the cumulative frequency of equal to or more than type of the class 0-10?
| Class (Marks) | Tally marks | Frequency | Cumulative frequency more than or equal to type |
| 0-10 | lll | 3 | 62 |
| 10-20 | lll | 3 | 62 – 3 = 59 |
| 20-30 | llll llll | 9 | 59 – 3 = 56 |
| 30- 40 | llll llll | 9 | 56 – 9 = 47 |
| 40-50 | llll llll lll | 13 | 47 – 9 = 38 |
| 50-60 | llll l | 6 | 38 – 13 = 25 |
| 60-70 | llll | 5 | 25 – 6 = 19 |
| 70-80 | llll l | 6 | 19 - 5 = 14 |
| 80-90 | llll | 5 | 14 – 6 = 8 |
| 90-100 | lll | 3 | 8 – 5 = 3 |
| Total N = 62 |
(i) The number of students scoring 40 or more than 40 marks is 38.
(ii) The number of students scoring 90 or more than 90 marks is 3.
(iii) The number of students scoring 60 or more than 60 marks is 19.
(iv) The cumulative frequency more than or equal to type of class 0-10 is 62.
Question 4.4. Using the data in example (3) above, prepare less than type cumulative frequency table and answer the following questions.
(i) How many students obtained less than 40 marks ?
(ii) How many students obtained less than 10 marks ?
(iii) How many students obtained less than 60 marks ?
(iv) Find the cumulative frequency of the class 50-60.
| Class (Marks) | Tally marks | Frequency | Cumulative frequency less than type |
| 0-10 | lll | 3 | 3 |
| 10-20 | lll | 3 | 3 + 3 = 6 |
| 20-30 | llll llll | 9 | 6 + 9 = 15 |
| 30-40 | llll llll | 9 | 15 + 9 = 24 |
| 40-50 | llll llll lll | 13 | 24 + 13 = 37 |
| 50-60 | llll l | 6 | 37 + 6 = 43 |
| 60-70 | llll | 5 | 43 + 5 = 48 |
| 70-80 | llll l | 6 | 48 + 6 = 54 |
| 80-90 | llll | 5 | 54 + 5 = 59 |
| 90-100 | lll | 3 | 59 + 3 = 62 |
| Total N = 62 |
(i) The number of students scoring less than 40 marks is 24.
(ii) The number of students scoring less than 10 marks is 3.
(iii) The number of students scoring less than 60 marks is 43.
(iv) The cumulative frequency less than type of class 50-60 is 43.
Practice set 7.5
Question 5.1. Yield of soyabean per acre in quintal in Mukund's field for 7 years was 10, 7, 5, 3, 9, 6, 9. Find the mean of yield per acre.
Given data : 10, 7, 5, 3, 9, 6, 9. n = 7
∴ mean \(\bar{x}=\frac{10+7+5+3+9+6+9}{7}=\frac{49}{7}\) = 7
Mean yield of soya bean per acre is 7 quintals.
Question 5.2. Find the median of the observations, 59, 75, 68, 70, 74, 75, 80.
Write the given data in the ascending order.
59, 68, 70, 74, 75, 75, 80.
n = 7 (Odd number)
∴ median is the value of the middle number.
The middle number is 74.
Median is 74.
Question 5.3. The marks (out of 100) obtained by 7 students in Mathematics' examination are given below. Find the mode for these marks.
99, 100, 95, 100, 100, 60, 90
Write the given data in the ascending order
80, 90, 95, 99, 100, 100, 100.
Here, the maximum frequency of score is 100.
Mode of marks is 100.
Question 5.4. The monthly salaries in rupees of 30 workers in a factory are given below.
5000, 7000, 3000, 4000, 4000, 3000, 3000, 3000, 8000, 4000, 4000, 9000, 3000, 5000, 5000, 4000, 4000, 3000, 5000, 5000, 6000, 8000, 3000, 3000, 6000, 7000, 7000, 6000, 6000, 4000
From the above data find the mean of monthly salary.
| (Salary in ₹) | Tally marks |
fi | fixi |
| 3000 | llll lll | 8 | 3000 × 8=24000 |
| 4000 | llll ll | 7 | 4000 ×7=28000 |
| 5000 | llll | 5 | 5000 × 5=25000 |
| 6000 | llll | 4 | 6000 × 4=24000 |
| 7000 | lll | 3 | 7000 × 3=21000 |
| 8000 | ll | 2 | 8000 × 2=16000 |
| 9000 | l | 1 | 9000 ×1= 9000 |
| Σfi = 30 | Σ fixi = 147000 |
mean \(\bar{x}=\frac{Σf_ix_i}{Σf_i}=\frac{147000}{30}\) = 4900
Mean salary is ₹ 4900
Question 5.5. In a basket there are 10 tomatoes. The weight of each of these tomatoes in grams is as follows 60, 70, 90, 95, 50, 65, 70, 80, 85, 95.
Find the median of the weights of tomatoes.
Write the given data in the ascending order.
50, 60, 65, 70, 70, 80, 85, 90, 95, 95
n = 10 (Even number)
∴ the 5th and the 6th numbers are in the middle position. These numbers are 70 and 80.
∴ median = \(\frac{70+80}{2}\) = 75
The median weight of tomatoes is 75 g.
Question 5.6. A hockey player has scored following number of goals in 9 matches.
5, 4, 0, 2, 2, 4, 4, 3, 3. Find the mean, median and mode of the data.
(i) The given data : 5, 4, 0, 2, 2, 4, 4, 3, 3. n = 9
mean \(\bar{x}=\frac{5+4+0+2+2+4+4+3+3}{9} = 3
For (ii) and (iii) : Write the given data in ascending order
0, 2, 2, 3, 3, 4, 4, 4, 5
(ii) n = 9 (Odd number)
∴ median is the value of the middle number.
The middle number is 3. ∴ median = 3.
(iii) Here, the maximum frequency of goals is 4. ∴ mode = 4.
Answer is : (i) Mean is 3 goals, (ii) Median is 3 goals, (iii) Mode is 4 goals.
Question 5.7. The calculated mean of 50 observations was 80. It was later discovered that observation 19 was recorded by mistake as 91. What was the correct mean?
Mean = \(\frac{\text{The sum of all observations}}{\text{Total number of observations}}\)
∴ The sum of all observations = Mean x Total number of observations
∴ The sum of 50 observations = 80 x 50 =4000
Sum of observations after correction = 4000 + 19 – 91 = 3928
∴ Corrected mean = \(\frac{\text{Sum of observations after correction}}{\text{Total number of observations}}\) = \(\frac{3928}{50}\) = 78.56
∴ The corrected mean is 78.56.
Question 5.8. Following 10 observations are arranged in ascending order as follows.
2, 3, 5, 9, x + 1, x + 3, 14, 16, 19, 20
If the median of the data is 11, find the value of x.
Observations are arranged in ascending order as follows:
2, 3, 5, 9, x + 1, x + 3, 14, 16, 19, 20
As, the number of observations = 10, which is an even number.
∴ The numbers in the five and six observations will come to the middle.
Median = 11
∴ median = \(\frac{(x+1)+(x+3)}{2}\)
∴ 11 = \(\frac{(x+1)+(x+3)}{2}\) = \(\frac{2(x+2)}{2}\) = x + 2
∴ x = 11 – 2 = 9
The value of x is 9
Question 5.9. The mean of 35 observations is 20, out of which mean of first 18 observations is 15 and mean of last 18 observation is 25. Find the 18th observation.
Mean = \(\frac{\text{The sum of all observations}}{\text{Total number of observations}}\)
∴ sum of observations = Mean x Total number of observations
∴ sum of 35 observations = 20 x 35 = 700
Sum of first 18th observations = 15 x 18 = 270
Sum of last 18th observations = 25 x 18 = 450
18th observation = Sum of first 18 observations + Sum of last 18 observations - 35th observations
= 270 + 450 - 700
= 720 – 700
= 20
∴ The 18th observation is 20.
Question 5.10. The mean of 5 observations is 50. One of the observations was removed from the data, hence the mean became 45. Find the observation which was removed.
∴ Sum of observations = Mean x Total number of observations
∴ sum of 5 observations = 50 x 5 = 250
Total no of observations when One of the observations was removed from the data = 4
∴ sum of 4 observations = 45 x 4 = 180
So, the observation which was removed = sum of 5 observations - sum of 4 observations
250 - 180 = 70
The observation which was removed is 70.
Question 5.11. There are 40 students in a class, out of them 15 are boys. The mean of marks obtained by boys is 33 and that for girls is 35. Find out the mean of all students in the class.
We have,
Number of students in a class = 40
Number of boys in a class = 15,
Mean of marks obtained by boys = 33
Mean of marks obtained by girls = 35
Number of girls in the class = 40 - 15 = 25
Sum of marks obtained by boys = Mean x Number of boys = 33 × 15 = 495
Sum of marks obtained by girls = 35 x 25 = 875
So, the mean of all students in the class = \(\frac{\text{Sum of marks obtained by students}}{\text{Number of students}}\)
= \(\frac{495+875}{40}=\frac{1370}{40}\) = 34.25
The mean of all students in the class is 34.25.
Question 5.12. The weights of 10 students (in kg) are given below :
40, 35, 42, 43, 37, 35, 37, 37, 42, 37. Find the mode of the data.
Arrange the given data in the ascending order.
35, 35, 37, 37, 37, 37, 40, 42, 42, 43.
The maximum frequency is 4. It is that of 37.
The mode of weight is 37 kg.
Question 5.13. In the following table, the information is given about the number of families and the siblings in the families less than 14 years of age. Find the mode of the data.
| No. of siblings | 1 | 2 | 3 | 4 |
| Families | 15 | 25 | 5 | 5 |
Here, the maximum frequency is 25 and it is of 2 siblings.
Mode is 2 siblings.
Question 5.14. Find the mode of the following data.
| Marks | 35 | 36 | 37 | 38 | 39 | 40 |
| No. of students | 09 | 07 | 09 | 04 | 04 | 02 |
Here, the maximum frequency is 9. This is for two marks 35 and 37.
Mode are 35 marks and 37 marks.
Problem set 7
Question 1. (1) Write the correct alternative answer for each of the following questions.
(i) Which of the following data is not primary ?
(A) By visiting a certain class, gathering information about attendence of students.
(B) By actual visit to homes, to find number of family members.
(C) To get information regarding plantation of soyabean done by each farmer from the village Talathi.
(D) Review the cleanliness status of canals by actually visitiing them.
(C) To get information regarding plantation of soyabean done by each farmer from the village Talathi.
(ii) What is the upper class limit for the class 25-35 ?
(A) 25 (B) 35 (C) 60 (D) 30
(B) 35
(iii) What is the class-mark of class 25-35 ?
(A) 25 (B) 35 (C) 60 (D) 30
(D) 30
Explanation:
class mark = \(\frac{\text{Lower class limit + Upper class limit}}{2}\) = \(\frac{25+35}{2}\) = 30
(iv) If the classes are 0-10, 10-20, 20-30... then in which class should the observation 10 be included ?
(A) 0-10 (B) 10-20
(C) 0-10 and 10-20 in these 2 classes (D) 20-30
(B) 10-20
Hint:
If the classes are exclusive, the given number should be included in the class having the lower limit.
(v) If is the mean of x1, x2............ xn and is the mean of y1, y2,…….yn and is the mean of x1, x2 ............xn , y1, y2,……….yn then z = ?
(A) \(\frac{\bar{x}+\bar{y}}{2}\) (B) \(\bar{x}+\bar{y}\) (C) \(\frac{\bar{x}+\bar{y}}{n}\) (D) \(\frac{\bar{x}+\bar{y}}{2n}\)
(A) \(\frac{\bar{x}+\bar{y}}{2}\)
(vi) The mean of five numbers is 50, out of which mean of 4 numbers is 46, find the 5th number :
(A) 4 (B) 20 (C) 434 (D) 66
(D) 66
Explanation:
Since, the mean of five numbers is 50, out of which mean of 4 numbers is 46
So, the 5th number
= Sum of 5th Observation - Sum of 4th Observations
= (50 × 5) - (46 × 4) = 250 – 184 = 66
(vii) Mean of 100 observations is 40. The 9th observation is 30. If this is replaced by 70 keeping all other observations same, find the new mean.
(A) 40.6 (B) 40.4 (C) 40.3 (D) 40.7
(B) 40.4
Explanation:
We have,
Mean of 100 observations is 40.
Total sum of observations = 100 x 40 = 4000
If the 9th observation is 30 and is replaced by 70 keeping all other observations same.
New, total sum of observations = 4000 - 30 + 70 = 4040
So, the new mean = 4040/100 = 40.4
(viii) What is the the mode of 19, 19, 15, 20, 25, 15, 20, 15?
(A) 15, (B) 20 (C) 19 (D) 25
(A) 15
Explanation:
Since, the observation 15 is occuring the most in the data: 19, 19, 15, 20, 25, 15, 20, 15
So, the mode of the given data is 15.
(ix) What is the median of 7, 10, 7, 5, 9, 10 ?
(A) 7 (B) 9 (C) 8 (D) 10
(C) 8
Explanation:
Since, the ascending order of the given data is as: 5, 7, 7, 9, 10, 10.
And, the number of observations is 6, which is even.
The third and fourth two numbers will be in the middle. They are 7 and 9, respectively.
So, the median of the given data = \(\frac{7+9}{2}\) = 8
(x) From following table, what is the cumulative frequency of less than type for the class 30-40 ?
| Class | 0-10 | 10-20 | 20-30 | 30-40 | 40-50 |
| Frequency | 7 | 3 | 12 | 13 | 2 |
(A) 13 (B) 15 (C) 35 (D) 22
(C) 35
Explanation:
The cumulative frequency less than type for the class 30-40 is 7 +3 + 12 + 13 = 35
Question 2. The mean salary of 20 workers is Rs.10,250. If the salary of office superintendent is added, the mean will increase by Rs.750. Find the salary of the office superintendent.
The mean salary of 20 workers is Rs.10,250.
The sum of salary of 20 workers = 10250 x 20 = Rs. 205000
Since, the mean will increase by Rs.750 if the salary of office superintendent is added
The mean salary of 21 workers including office superintendent = 10250 + 750 = Rs. 11000
The sum of salary of 21 workers including office superintendent = 11000 x 21 = Rs. 231000
So, the salary of the office superintendent = 231000 - 205000 = Rs. 26000.
Question 3. The mean of nine numbers is 77. If one more number is added to it then the mean increases by 5. Find the number added in the data.
We have, the mean of nine numbers is 77.
The sum of nine numbers = 77 x 9 = 693.
The new mean when one more number is added to it = 77 + 5 = 82.
The sum of ten numbers = 82 x 10 = 820.
So, the number added in the data = 820 - 693 = 127.
Question 4. The monthly maximum temperature of a city is given in degree celcius in the following data. By taking suitable classes, prepare the grouped frequency distribution table
29.2, 29.0, 28.1, 28.5, 32.9, 29.2, 34.2, 36.8, 32.0, 31.0, 30.5, 30.0, 33, 32.5, 35.5, 34.0, 32.9, 31.5, 30.3, 31.4, 30.3, 34.7, 35.0, 32.5, 33.5, 29.0, 29.5, 29.9, 33.2, 30.2
From the table, answer the following questions.
(i) For how many days the maximum temperature was less than 34oC ?
(ii) For how many days the maximum temperature was 34oC or more than 34oC ?
The grouped frequency distribution table of the given data is as follows:
| Class (Temperature) | Tally marks | Frequency |
| 28 - 30 | llll lll | 8 |
| 30 - 32 | llll lll | 8 |
| 32 - 34 | llll lll | 8 |
| 34 - 36 | llll | 5 |
| 36 - 38 | l | 1 |
| Total N=30 |
(i) The number of days the maximum temperature was less than 34C = 8 + 8 + 8 = 24.
(ii) The number of days the maximum temperature was 34C or more than 34C = 5 + 1 = 6.
Question 5. If the mean of the following data is 20.2, then find the value of p.
| xi | 10 | 15 | 20 | 25 | 30 |
| fi | 6 | 8 | p | 10 | 6 |
| xi | fi | fixi |
| 10 | 6 | 60 |
| 15 | 8 | 120 |
| 20 | P | 20 |
| 25 | 10 | 250 |
| 30 | 6 | 180 |
| Σ fi = 30 + p | Σ fixi = 610 + 20p |
Mean (x) = \(\frac{Σf_ix_i}{Σf_i}\)
20.2 = \(\frac{610+20p}{30+p}\)
∴ 20.2 (30 + p) = 610 + 20p
∴ 606 + 20.2p = 610 + 20p
∴ 20.2p - 20p = 610 + 606
∴ 0.2p = 4 ∴ p = 4/0.2 = 20
The value of p is 20.
Question 6. There are 68 students of 9th standard from model Highschool, Nandpur. They have scored following marks out of 80, in written exam of mathematics.
70, 50, 60, 66, 45, 46, 38, 30, 40, 47, 56, 68, 80, 79, 39, 43, 57, 61, 51, 32, 42, 43, 75, 43, 36, 37, 61, 71, 32, 40, 45, 32, 36, 42, 43, 55, 56, 62, 66, 72, 73, 78, 36, 46, 47, 52, 68, 78, 80, 49, 59, 69, 65, 35, 46, 56, 57, 60, 36, 37, 45, 42, 70, 37, 45, 66, 56, 47
By taking classes 30-40, 40-50, .... prepare the less than type cumulative frequency table Using the table, answer the following questions :
(i) How many students, have scored marks less than 80 ?
(ii) How many students have scored marks less than 40 ?
(iii) How many students have scored marks less than 60 ?
| Class
(Marks) |
Tally Marks | Frequency | Cumulative Frequency (less than type) |
| 30-40 | llll llll llll | 14 | 14 |
| 40-50 | llll llll llll llll llll | 20 | 14+20 = 34 |
| 50-60 | llll llll l | 11 | 34 +11 = 45 |
| 60-70 | llll llll ll | 12 | 45 + 12= 57 |
| 70-80 | llll llll | 9 | 57+ 9=66 |
| 80-90 | ll | 2 | 66+ 2 = 68 |
| Total N = 68 |
(i) 66 students scored less than 80 marks.
(ii) 14 students scored less than 40 marks.
(iii) 45 students scored less than 60 marks.
Question 7. By using data in example (6), and taking classes 30-40, 40-50... prepare equal to or more than type cumulative frequency table and answer the following questions based on it.
(i) How many students have scored marks 70 or more than 70 ?
(ii) How many students have scored marks 30 or more than 30 ?
| Class
(Marks) |
Tally Marks | Frequency | Cumulative Frequency (less than type) |
| 30-40 | llll llll llll | 14 | 14 |
| 40-50 | llll llll llll llll llll | 20 | 14+20 = 34 |
| 50-60 | llll llll l | 11 | 34 +11 = 45 |
| 60-70 | llll llll ll | 12 | 45 + 12= 57 |
| 70-80 | llll llll | 9 | 57+ 9=66 |
| 80-90 | ll | 2 | 66+ 2 = 68 |
| Total N = 68 |
(i) 11 students scored 70 or more than 70 marks.
(ii) 68 students scored 30 or more than 30 marks.
Question 8. There are 10 observations arranged in ascending order as given below.
45, 47, 50, 52, x, x+2, 60, 62, 63, 74. The median of these observations is 53. Find the value of x. Also find the mean and the mode of the data.
The 10 observations are arranged in ascending order as given below.
45, 47, 50, 52, x, x + 2, 60 ,62 ,63 ,74.
Since, the number of observations is 10, which is an even number.
∴ 5th 6th and two such numbers mark in the middle. They are x + x + 2 respectively.
The median of the given observations is 53.
∴ Median = \(\frac{x+x+2}{2}\)
∴ 53 = \(\frac{2x+2}{2}\) = \(\frac{2{x+1}{2}\) = x + 1
∴ 53 - 1 = x
∴ x = 52
Given data = 45, 47, 50, 52, 52, 54, 60, 62, 63, 74.
∴ Mean = \(\frac{\text{The sum of all observations}}{\text{Total number of observations}}\)
= \(\frac{45+47+50+52+52+54+60+62+63+74}{10}=\frac{559}{10}\)
∴ Mean = 55.9
Since, the observation that is occurring the maximum is 52.
So, the mode of the data is 52.