
Notes
We have learnt about, simple bar diagram and joint bar diagram.
Joint bar diagram is useful in comparing the information in the given data.
Sub-divided bar-diagram :
- A single bar is used to represent a subdivided bar diagram. Different parts of the subdivided bar diagram are shown by shaded/unshaded parts.
- To draw a subdivided bar diagram, we add the numerical values of the entities, decide a scale and show the total by a bar proportional to the scale.
- This type of diagram is also useful in comparing the information in the given data.
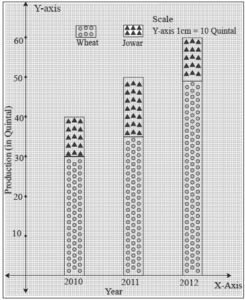
Example : Production of Wheat and Jowar in the given year.
| Year | Production of Wheat (Quintal) | Production of Jowar (Quintal) |
| 2010 | 30 | 10 |
| 2011 | 35 | 15 |
| 2012 | 48 | 12 |
Sub-divided bar-diagram :
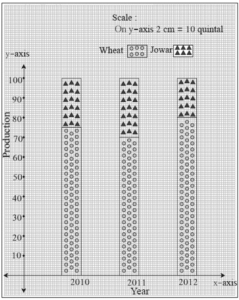
Percentage bar-diagram :
Percentage bar diagram is a special type of subdivided bar diagram. The information given in the data is converted into percentages. All the bars are drawn of equal heights (i.e. 100).
Example :
| Year | Production of Wheat (Quintal) | Production of Jowar (Quintal) | Percentage production of Wheat as compared to total production | Percentage production of Jowar |
| 2010 | 30 | 10 | \(\frac{30}{40}\) x 100 = 75% | 100 – 75 = 25% |
| 2011 | 35 | 15 | \(\frac{35}{50}\) x 100 = 70% | 100 – 70 = 30% |
| 2012 | 48 | 12 | \(\frac{48}{60}\) x 100 = 80% | 100 – 80 = 20% |
Percentage bar-diagram :
Statistics :
Statistics is the science of group analysis, focusing on individual cases as sample cases to draw conclusions about a group. The term comes from the Latin word status, meaning 'a political state', and is linked to administrative affairs of a state. Sir Ronald Aylmer Fisher, known as the father of modern statistical science, played a significant role in the development of this field.
Data collection :
Data : The information that we collect about a particular group is mostly in numerical nature, called data.
Primary data : When an investigator collects data according to the plan and objective in the view, the data is called primary data.
- It requires more time to collect.
- It is up to date and detailed information.
- It is correct and reliable.
Secondary data : When an investigator uses data already collected by other agencies or official data published, the data is called secondary data.
- It is readily available, so needs less time.
- It is taken from already collected data. It is not necessarily up to date. It may lack in details also.
- It may be less reliable.
Classification of data :
The raw data are made more meaningful by dividing it into different groups or classes. This process is called classification of data or frequency distribution.
- The raw data is arranged in the ascending or descending order. The repeated occurrence of a number is shown by tally marks.
- Three columns, scores, tally marks and frequency, are prepared and entries are made in them.
- The total of all frequencies is denoted by N.
- The sum of all frequencies is denoted by ∑fi (read as sigma fi ).
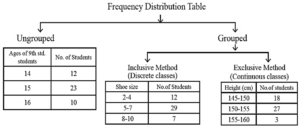
Grouped frequency distribution table :
- When the number of observations is large, it becomes difficult to handle, to analyse and to interpret the data by ungrouped frequency distribution table.
- So when the number of observations is large, groups are made.
There are two methods of making group frequency distribution table.
(1) Inclusive method (Discontinuous form)
(2) Exclusive method (Continuous form)
(1) Inclusive method (Discrete classes) :
Some important terms :
(i) Range of the data : The difference between the largest and the smallest number in the data is called the range of the data.
- If in the given data, the smallest number is ‘x’ and the largest number is y, then the range of this data is y - x = 39.
Example : The record of marks out of 20 in Mathematics in the first unit test is as follows.
20, 6, 14, 10, 13, 15, 12, 14, 17, 17, 18, 11, 19, 9, 16, 18, 14, 7, 17, 20, 8, 15, 16, 10, 15, 12, 18, 17, 12, 11, 11, 10, 16, 14, 16, 18, 10, 7, 17, 14, 20, 17, 13, 15, 18, 20, 12, 12, 15, 10.
Solution :
lets us arrange the data in ascending order.
6, 7, 7, 8, 9, 10, 10, 10, 10, 10, 11, 11, 11, 12, 12, 12, 12, 12, 13, 13, 14, 14, 14, 14, 14, 15, 15, 15, 15, 15, 16, 16, 16, 16, 17, 17, 17, 17, 17, 17, 18, 18, 18, 18, 18, 19, 20, 20, 20, 20.
In the above scores the smallest is 6 and the largest is 20. The difference between largest and smallest scores is 20 - 6 = 14. This difference is called as ‘Range of the data’.
(ii) Classes or Class intervals : When the observations are divided into suitable groups, each of the groups is called a ‘Class’.
Example : The numbers 6 to 20 of the given data as discussed above, distributed in convenient groups as 6 to 10, 11 to 15, ... , 16 to 20, are called classes or class intervals.
(iii) Class limit : The end values of the classes are called class limits.
Example : For the class 6-10, the lower class limit is 6 and the upper class limit is 10.
(iv) Frequency : The number of observations in the data for a particular class is called the frequency of that class.
Example : In the above data, there are 20 observations in the class 11 to 15. Hence frequency of the class 11 - 15 is 20
(v) Class width or class size or class interval : The difference between the lower limits (or upper limits) of any two consecutive class intervals is called the class width or the length of the class or the size of the class.
Example : if 5 - 10, 10 - 15, 15-20, ...are given classes, class width of 5-10 is 10 - 5 = 5 [i.e. the difference between the lower class limits or the upper class limits. ]
(vi) Class mark : The arithmetic mean of the upper and lower class limits of a class is called the class mark (or mid-value) of the class interval.
Class mark = \(\frac{text{lower class limit + upper class limit}}{2}\)
Example : The class mark of the class 21 to 30 = \(\frac{21+30}{2}\) = 25.5
Note : The difference between two consecutive class marks is also the class width or the length of the class.
(2) Exclusive Method (Continuous classes) :
If we take the class intervals 21 to 30, 31 to 40, ... any observation between 30 and 31 cannot be included in the table.
If we take the classes 21 to 31, 31 to 41, ... the problem arises in which class should 31 be included. To avoid this difficulty, it is customary that for every class interval the lower limit is included in the class and the upper limit is excluded from it.
e.g. 31 should be included in the class 31 to 41 and not in the class 21 to 31.
Class Boundaries : In the inclusive method, to make the classes continuous, the average of the upper class limit of a class and the lower class limit of its next consecutive class is called the true upper limit of that class, which is also the true lower limit of the next consecutive class. In this way, we get continuous classes.
Example : 21 to 30, 31 to 40, ... , 51 to 60 are non-continuous classes.
\(\frac{30+31}{2}\) = \(\frac{61}{2}\) = 30.5 which is the true upper limit of the class 21 to 30 and the true lower limit of the class 31 to 40.
Thus, we get continuous classes 20.5 to 30.5, 30.5 to 40.5, ... , 50.5 to 60.5.
Remember :
Cumulative frequency :
(i) Less than Cumulative frequency less than the upper class limit :
The following information is regarding marks in mathematics, obtain out of 100, scored by 50 students of 9th std. in the first unit test.
| Class (Marks) | f | cf (less than type) | Meaning |
| 0-20 | 4 | 4 | 4 students got less than 20 marks |
| 20-40 | 8 | 4 + 8 = 12 | 12 students got less than 40 marks |
| 40-60 | 20 | 12 + 20 = 32 | 32 students got less than 60 marks |
| 60-80 | 12 | 32 + 12 = 44 | 44 students got less than 80 marks |
| 80-100 | 6 | 44 + 6 = 50 | 50 students got less than 100 marks |
| Total | 50 |
(ii) Cumulative frequency more than or equal to the lower class limit
The following information is regarding marks in mathematics, obtain out of 100, scored by 50 students of 9th std. in the first unit test.
| Class (Marks) | f | cf (less than type) | Meaning |
| 0-20 | 4 | 50 | 50 students got 0 or more than 0 mark |
| 20-40 | 8 | 50 - 4 = 46 | 46 students got 20 or more than 20 marks |
| 40-60 | 20 | 46 - 8 = 38 | 38 students got 40 or more than 40 marks |
| 60-80 | 12 | 38 - 20 = 18 | 18 students got 60 or more than 60 marks |
| 80-100 | 6 | 18 - 12 = 6 | 6 students got 80 or more than 80 marks |
| Total | 50 |
Measures of central tendency :
Central tendency : The numbers in the data tend to cluster around a certain number. This property is called the central tendency of the group.
Measure of the central tendency : The number around which the numbers in the data tend to cluster is called the measure of the central tendency.
The following measures of central tendency are used :
(i) Mean : The arithmetical average of all observations in the given data is known as mean.
Mean = \(\frac{text{The sum of all observations in the data}}{\text{Total no of observations}}\)
Example : Find the mean of numbers 25, 30, 27, 23 and 25
Mean = \(\frac{25+30+27+23+25}{5}=\frac{130}{5}\) = 26
Mean of ungrouped data :
If x1, x2, ... , xn are observations with frequencies f1, f2, ... fn , then x1 is repeated f1 times, x2 is repeated f2 times, etc. respectively.
∴ on addition of observations we write f1x1 + f2x2 + f3x3 + ... + fnxn
Mean of the given data is given by
\(\bar{x}=\frac{f_1x_1+f_2x_2+f_3x_3.....+f_nx_n}{f_1+f_2+f_3.....+f_n}\)
i.e. \(\bar{x}=\frac{1}{N}Σf_ix_i\), where Ν = ∑fi
The symbol ∑ is called sigma or summation.
Example : The first unit test of 40 marks was conducted for a class of 35 students. The marks obtained by the students were as follows. Find the mean of the marks.
40, 35, 30, 25, 23, 20, 14, 15, 16, 20, 17, 37, 37, 20, 36, 16, 30, 25, 25, 36, 37, 39, 39, 40, 15, 16, 17, 30, 16, 39, 40, 35, 37, 23, 16.
Solution :
The sum of marks of all students is worked out in the following table.
| Marks
(xi) |
No. of students
(fi) |
fi × xi |
| 14 | 1 | 14 × 1 = 14 |
| 15 | 2 | 30 |
| 16 | 5 | 80 |
| 17 | 2 | 34 |
| 20 | 3 | 60 |
| 23 | 2 | 46 |
| 25 | 3 | 75 |
| 30 | 3 | 90 |
| 35 | 2 | 70 |
| 36 | 2 | 72 |
| 37 | 4 | 148 |
| 39 | 3 | 117 |
| 40 | 3 | 120 |
| Ν = ∑fi = 35 | ∑fixi = 965 |
\(\bar{x}=\frac{1}{N}Σf_ix_i\) = \(\frac{965}{35}\) = 27.31 marks (approximately)
∴ mean of the given data is 27.31
(ii) Median : Median is the value of that observation for given data which divides the data into two equal parts, when the values in the data are arranged in the ascending or descending order.
- When the number of observations (n) is odd, median is the value of the middle number.
- When the number of observations (n) is even, median is the average of the middle two numbers.
Example : Find the median of 54, 63, 66, 72, 98, 87, 92.
Solution : Let us write the given observations in the ascending order.
54, 63, 66, 72, 78, 87, 92.
Here the 4th number is at the middle position, which is 72
∴ Median of the scores = 72
(iii) Mode : The observation that possesses maximum frequency (greater than 1) in the given data is called a mode. Mode may or may not be unique or it may not exist.
Example : Find the mode of 90, 55, 67, 55, 75, 75, 40, 35, 55, 95, 75.
Solution : If the data is arranged in ascending order, it is easy to find the observation repeating maximum number of times.
Ascending order of given data. 35, 40, 55, 55, 55, 67, 75, 75, 75, 90, 95
Here the maximum frequency is 3; but this is the frequency is of two observations.
The observation repeated maximum number of times = 55 and 75
∴ mode for the given data is 55 and 75